
User experience (UX) and usability are decisive factors in the success of digital applications. For companies that develop digital products, measuring user experience and usability is therefore essential. Both user experience (UX) and usability are most easily measured by surveying users. UX surveys and evaluations are straightforward to run online. In the following sections, you will learn which quantitative and qualitative methods are used to measure user experience and usability, how you can determine user experience and ease of use with online questionnaires and which factors need to be considered when it comes to UX. In addition, we provide questionnaire templates and give tips on evaluating user experience.
Table of Contents
Methods for measuring UX and usability
There are a number of methods for measuring the user experience (UX) and usability of digital applications. Analysing technical metrics (time on page, conversion rate, bounce rate, etc.) alone is not enough, as they provide only limited insight into user behaviour. In particular, they do not capture the reasons and causes behind that behaviour. It is therefore very important for companies in the digital sector to generate direct feedback from users. After all, UX and usability are among the most important success factors when it comes to marketing digital products and shaping brand perception. In the following sections, we present the different methods for measuring the user experience and usability of digital products. You will also learn which user analytics tools can be used alongside online surveys to draw conclusions about UX maturity.
UX questionnaires for measuring user experience: UEQ & UEQ-S
To determine the user experience, and thus the UX maturity, of digital applications, online questionnaires are used in addition to classic usability tests. Online surveys capture and evaluate users’ subjective perceptions. A number of standard questionnaires are available for this purpose, with which UX factors such as efficiency, attractiveness and stimulation (“joy of use”) can be examined. The standard questionnaires include, for example, the UEQ (User Experience Questionnaire) and its short version, the UEQ-Short.
With the UEQ, users are asked to choose between contrasting terms (opposite poles). The pairs of opposites between which users can choose on a scale include, for example, “complicated” <-> “easy” and “inefficient” <-> “efficient”. Within a questionnaire, a so-called semantic differential is therefore used, in which users are asked to rate the product on a scale between pairs of opposing words. In this way, users’ subjective impression of the product’s user experience is measured.
The pairs of opposites are used to capture the relevant aspects of the user experience. The UEQ takes into account both pragmatic UX aspects and experiential and aesthetic factors. Classic usability criteria such as comprehensibility and reliability are therefore examined, as are the UX criteria of stimulation and originality.
The UEQ sheds light on the following UX aspects:
- attractiveness
- clarity/comprehensibility
- efficiency
- reliability/trustworthiness
- stimulation
- novelty/originality
The UEQ’s semantic differential comprises 26 items, the short version “UEQ-Short” 8 items. The short version “UEQ-Short” is intended for use cases in which the full version might seem too long to users, for example when a UX questionnaire is to be completed immediately after an order on a website. This is because the shorter the survey, the lower the drop-out rate tends to be. The UEQ-Short can also be used as a supplement to a classic customer survey when UX aspects are to be captured more or less in passing. You will find a free “UEQ-Short” questionnaire template further down this page.
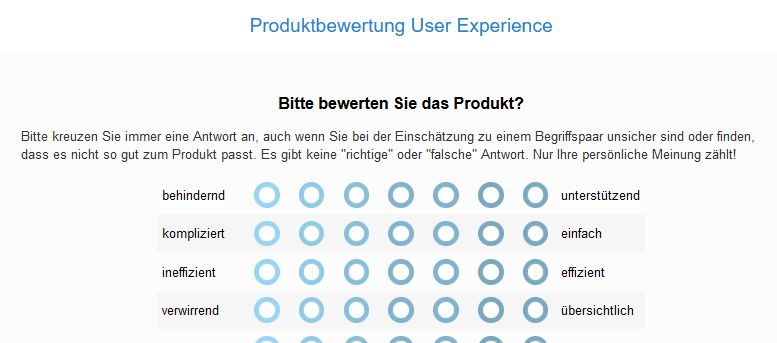
Fig.: Excerpt from the UEQ questionnaire for determining UX maturity
When creating customer surveys, feel free to use our free templates, which you can copy into your account with a single click and adjust there as required: Questionnaire templates for customer surveys
Measuring usability with the System Usability Scale (SUS)
The System Usability Scale (SUS) is a proven instrument for measuring the usability of digital applications and systems. The SUS can be used to measure the usability and ease of use of software products, websites, apps, tools, etc. The SUS score can range between 0 (worst usability) and 100 (best possible usability).
The SUS score is determined using a short questionnaire that is usually presented to users online. The questionnaire contains 10 statements (items) that survey participants rate on a five-point Likert scale (from complete agreement to complete disagreement). Each item is scored from 4 to 0 points, or from 0 to 4 points for negatively worded statements.
An example of how points are awarded:
- If a participant strongly agrees with the statement “I find the app easy to use”, 4 points are awarded.
- If a participant strongly agrees with the (negatively worded) statement “I find the app unnecessarily complex”, 0 points are awarded.
In the SUS questionnaire template that we provide further down this page, the points are already set up accordingly.
Calculating the SUS score
The SUS score is calculated by adding up the average values of the 10 items and multiplying the resulting sum by 2.5. Since the maximum average value per item is 4, adding up all 10 average values can produce a maximum of 40 points. Multiplied by 2.5, a best-possible SUS score of 100 is therefore achievable.
The SUS score can therefore range between 0 (= worst usability) and 100 (= best possible usability). If the SUS score determined is below 68, the usability of the application is considered below average, meaning there are significant usability problems. Values of 68 and above indicate good to perfect (100) usability.
The original calculation of the SUS score was complicated because the questions were sometimes positively and sometimes negatively worded. The improved SUS 2.0 does away with this cumbersome calculation. You can find detailed information here: SUS 2.0 – LamaPoll’s improved System Usability Scale
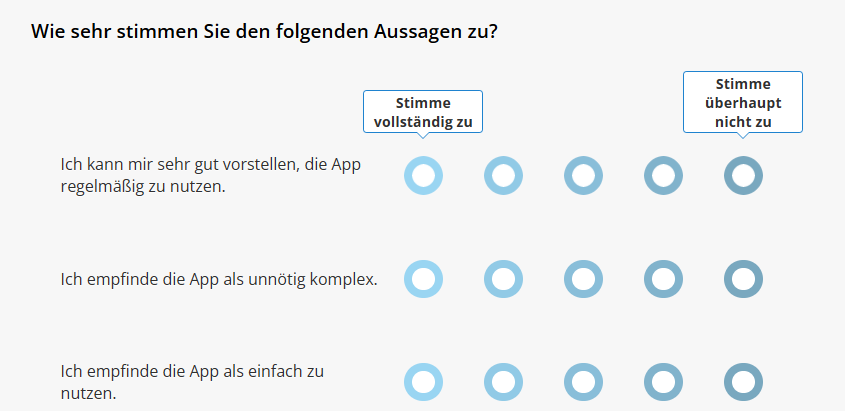
Fig.: Excerpt from an online questionnaire for determining the SUS score
SUS: interpreting the results
A score of 100 is optimal but unrealistic. But what about 70? Is 65 above average? There are various approaches to interpreting the SUS score. Most have one thing in common – values below 40 are really poor and a SUS score above 70 is excellent. As is usual with any benchmark, the aim on repetition should therefore always be a higher score (or a consistently high score).
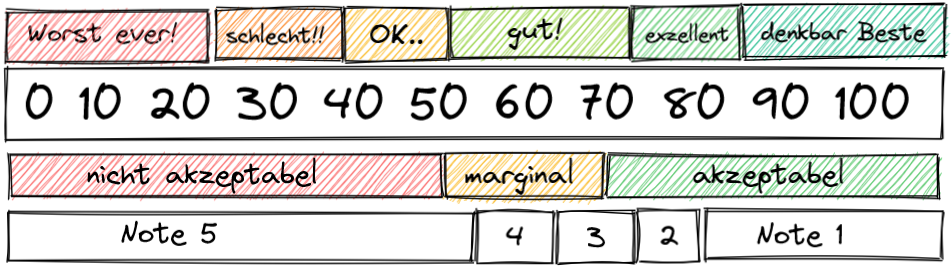
Fig.: Interpreting the SUS score
Advantages and disadvantages of the SUS score
Advantages of the SUS score:
- Very versatile
- Cost-effective and quick to carry out
- Repeatable and therefore comparable over time
- Internationally comparable benchmark
- Under certain circumstances also comparable across systems (app/website/system/software, etc.)
Disadvantages of the SUS (no longer present in the improved SUS 2.0!):
- No input on the product’s weaknesses (in contrast to the extended NPS with a comment field, for example)
- Somewhat cumbersome to calculate
The System Usability Scale was developed in 1986 by John Brooke. The SUS method for measuring usability remains one of the relevant procedures in user research, as the score is reliable and enables comparisons.
Gathering user feedback with online forms
With feedback forms, you give customers the opportunity to express their needs, wishes and criticisms regarding your digital products. Feedback forms can be embedded on your own website without any difficulty. For example, an online form can be used to determine in a structured way whether users are satisfied with the products, which features they miss or why they no longer wish to use an offering.
Forms are also used as part of churn management to identify customers who may be about to leave, to determine the reasons for their potential departure and thus to draw conclusions about (unmet) customer needs (see also: identify customer needs). You can find detailed information on the various ways online forms can be used, as well as form templates, in this article: Create your own online forms
Data analysis: website metrics and user analytics tools
Analysing technical metrics, such as the bounce rate and time spent on the website, only allows indirect conclusions to be drawn about UX and usability. However, the analysis can provide supporting clues and point to weaknesses. In addition, visualisation and analysis software can be used to analyse a website’s usability and UX. For example, session replays can be used to record visitor sessions so that user behaviour can be traced.
Furthermore, heat maps can be used to visualise user activity, representing the intensity of visitor interactions using a warm-to-cold colour scheme. Areas of the website that are frequently clicked by users are marked with a warm colour, for example. Other user analytics tools are clickmaps, scrollmaps, hover maps (also known as mouse tracking) and eye-tracking maps. Please note: when using such analytics tools, it is essential to ensure GDPR compliance.
Questionnaire templates: measuring UX & usability
Both user experience (UX) and usability are most easily measured through online surveys of users. User feedback can also be gathered via online forms. When creating your questionnaires and forms, feel free to use our free templates, which you can copy into your LamaPoll account with a single click on “Use” and then customise there as required.