
You can obtain a representative sample for your online survey by calculating the sample size in advance. You can use the sample size calculator on this page to do this. We also introduce the formula that is usually used as the basis for calculating sample size. First, we explain all the terms in the formula, then answer the central questions: How do you calculate the optimal sample size for your current survey project? How many people do you need to survey to obtain representative results?
Table of Contents
Use the sample size calculator for your online survey
How do I obtain a representative sample for my survey?
Whether a survey is representative depends heavily on its sample size. A survey must be large enough to produce meaningful, reliable results. Put another way, surveys are representative when the sample, meaning the survey participants, allows conclusions to be drawn about the wider population. But how do you ensure an appropriate sample? To achieve a 100% match between the results and the views of everyone in Germany, you would theoretically have to survey more than 80 million people. Fortunately, that is not necessary. If results that are “only” 95% accurate are good enough for you, around 1,000 respondents will probably do. Probability theory helps you estimate how far your results may differ from the true values.
Calculating sample size: the key terms
To understand the formulas below, it helps to clarify the key terms first.
Population (N) and sample size (n)
- Population (N) means the complete group of people you want to study. For all Europeans, the population would be around 750 million. For smokers in Germany, it would be around 12 million.
- Sample size (n) is the number of people surveyed as representatives of the population. This is the value to calculate: how many people must be approached to make a representative statement about, for example, Germany's 84 million residents?
Confidence level and confidence interval
This is where it gets slightly more complex. The confidence level indicates the probability that the survey result is correct. More precisely, it is the probability that the result lies within a particular interval, the confidence interval.
Admittedly, this is simplified: in step 5, we simply say that we calculate the confidence interval. Ultimately, the confidence interval is the +/- margin of error (E) within which the true value lies. This margin of error arises because we do not survey the entire population.
What does this mean for calculating sample size? We must set both values, the confidence level and the confidence interval (margin of error), in advance. For example, we aim for a result where we can say with 95% confidence that our result is not exact but differs from reality by no more than +/- 3%.
Proportion of the characteristic (p)
Another key term is (p), the proportion of the characteristic within the population. (p) is a percentage expressed as a decimal. It can range from 0 to 100%. The value may be known, unknown or more or less easy to establish. Suppose you are investigating smokers in a city. If you do not know their proportion, you can conduct a preliminary survey, then use its result to calculate the required sample. Or you can take the simpler route and use 0.5. This is the most conservative choice because the sample-size formula uses p*(1-p), which reaches its maximum at 0.5. Your calculated sample size may be unnecessarily large, but you will be on the safe side.
Z-score
Finally, calculating sample size also requires the Z-score. Put simply, it indicates how far a particular value is from the mean, measured in standard deviations. It helps us understand how unusual a value is relative to the average and how confident we can be in our conclusions. The good news is that you do not need to calculate it: you can look it up in a Z-score table. Here are the Z-scores for the most commonly used confidence levels:
| Required confidence level | Z-score |
|---|---|
| 90% | 1.65 |
| 95% | 1.96 |
| 99% | 2.58 |
Calculate sample size using a simple formula
You can also calculate the optimal sample size without knowing the population size, using a simple formula. As described above, you need several variables, all of which can be set in advance, estimated with reasonable certainty, calculated or taken from a table:
- Look up the Z-score in the Z-score table.
- Set p conservatively to 0.5.
- Set the margin of error and confidence level.
Put together, this gives the following formula:
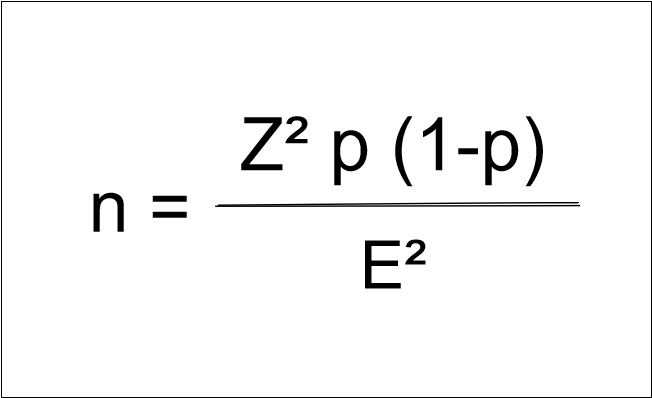 Fig. 1: Formula for calculating sample size
Since we calculate with p = 0.5 and therefore p(1-p) = 0.25, the following formula applies to unknown population distributions:
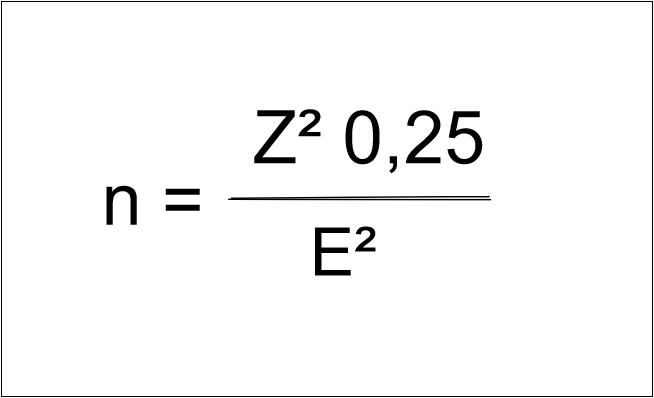 Fig. 2: Formula for calculating sample size with p = 0.5
Calculating sample size: an example
A practical example makes the calculation clearer. We want to conduct a survey on smoking behaviour in Germany and calculate the sample size based on certain assumptions.
We use a 95% confidence level, which corresponds to a Z-score of 1.96 (see the table above), and a margin of error (E) of 3% (0.03). The current proportion of smokers in Germany is around 24% (p).
We calculate:
n = (1.96^2 * 0.24 * (1 - 0.24)) / 0.03^2
n ≈ 779
We would therefore need to survey around 779 people.
If we did not know the proportion of smokers and used the conservative maximum value of 0.5 for p, the required sample would be larger: 1,068 people.
Obtaining the smallest meaningful sample size
The example above shows that far more participants are required when we do not know the distribution. However, recruiting representative, willing participants is either very time-consuming or very expensive (online panels). It therefore makes sense to use the smallest meaningful sample. The formula components are the levers:
- Confidence level: the lower it is, the fewer participants are needed.
- Margin of error: the lower it is, the more participants need to be recruited.
- Distribution: the further it is from 0.5 (closer to 0 or 1), the fewer participants you need and the smaller the sample.
You can set the confidence level and margin of error freely. The key question is how precise your project results need to be, and this may also be prescribed. The distribution offers more scope: where it is unknown, a preliminary survey often makes sense. In the example above, it would be advisable to run a representative preliminary survey first to establish the proportion of smokers.
Calculating sample size when the population size is known
You can also calculate sample size when the population size (N) is known. This requires an extended formula:
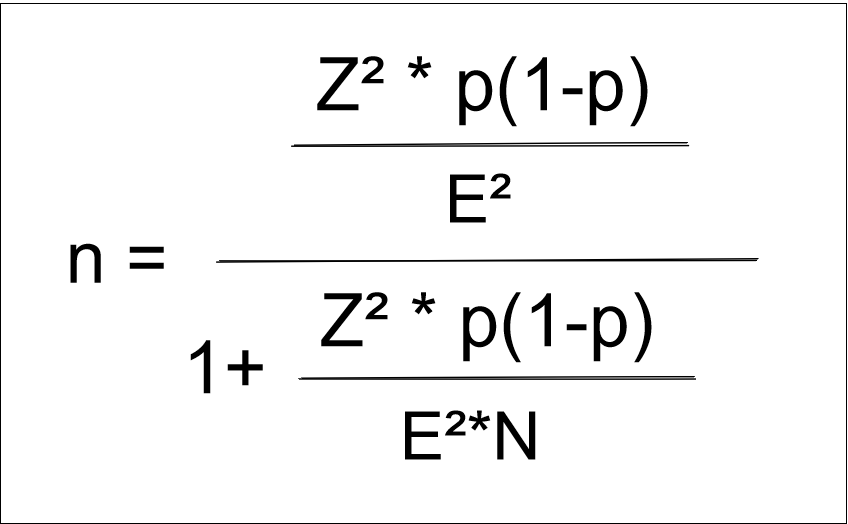 Fig. 3: Extended formula for calculating sample size when the population size is known
Example of calculating sample size when the population (N) is known: 5,000 employees, a required confidence level of 95%, a margin of error of 5% and an unknown proportion of the characteristic within the population.
- N = 5,000
- Z = 1.96 (corresponding to a 95% confidence level)
- p = 0.5
- E = 0.05 (precision of ±5%)
We then calculate:
n = (5000 * 1.96^2 * 0.5 * (1 - 0.5)) / ((5000 - 1) * 0.05^2 + 1.96^2 * 0.5 * (1 - 0.5))
n = (5000 * 3.8416 * 0.25) / (4999 * 0.0025 + 3.8416 * 0.25)
n = 4,802 / 13.458
n ≈ 357
We would therefore need to survey around 357 of the 5,000 employees. Without taking the population size into account, it would be 385.
By the way: Once you have calculated the optimal sample size for your survey project, the next step is to invite participants to your survey. Our tool provides several ways to do this. You can read more in our Help Centre: Inviting participants to a survey
The most common errors in sample-size calculation
Several errors can occur when calculating sample size. Here are the five most common mistakes to avoid when calculating the sample size for your survey project.
- Insufficient sample size: A sample that is too small can produce inaccurate or non-representative results. For a small population, for example fewer than 100 people, a census is advisable.
- Selection bias: If the sample is not selected randomly and particular groups are favoured or disadvantaged, this can distort the results.
- Non-representative sample: If the sample does not reflect the whole population well, the results cannot be generalised.
- Self-selection: Where participation is voluntary, people with certain characteristics may be more likely to take part, which can lead to bias.
- Outliers: Individual extreme values can have a strong effect on the result if they are not handled appropriately.
Managing risk factors in sample-size calculation
Various measures can prevent or reduce errors in sample-size calculation:
- Insufficient sample size: Calculating the required sample size before collecting data ensures that enough data points are available to achieve meaningful results. That is exactly what this guide is for: to help you choose sample size mathematically rather than by gut feeling or common sense. Use statistical methods based on the desired confidence level, expected variance and expected effect.
- Selection bias: To avoid selection bias, draw a random sample. You can do this through techniques such as simple random sampling, stratified random sampling or cluster sampling. This ensures that every unit in the population has an equal chance of being included. The same applies to a non-representative sample.
- Self-selection: If self-selection is a problem, take appropriate steps to increase willingness to participate and reach a broader base of participants. This can include incentives and careful communication across different channels.
- Outliers: When handling outliers, distinguish genuine outliers, meaning truly unusual values, from measurement errors. You can use robust statistical methods that are less sensitive to outliers, or review and, where appropriate, correct outliers before analysis.
Survey creators should take great care when calculating and selecting samples, choosing methods and procedures that suit the particular requirements and conditions of their study.
Extreme cases in sample-size calculation
Sometimes a sample of n = 1 is entirely sufficient. When you cook a soup and want to know whether it needs more pepper, you do not need to eat the whole pot. A small spoonful is enough because you have stirred it thoroughly and the characteristic, its pepper content, is the same throughout. In market research, this would be the extreme case of zero variance: a sample of n = 1 is enough. If every data point has the same value, n = 1 is sufficient. You only need to ask one person what today's date is.
Back to the soup. Imagine you have been daydreaming for a moment. You look at the soup with the salt shaker in your hand. You have not stirred it yet, but have you already added salt? How many spoonfuls would you have to taste to say with a sufficiently high probability whether there is salt in it? Unless you eat everything, including the very last spoonful, you cannot be 100% certain whether the soup is salted. Eating the soup would be effective, but far from efficient. This is where probability theory comes in: apply the formula above, mentally divide the soup into X spoonfuls, settle for a probability of 99% and get started.
What is LamaPoll?
LamaPoll is a survey tool for creating online questionnaires. Our survey tool lets you create, run and analyse online questionnaires quickly and easily. Create your questionnaire in just a few steps, customise it for your organisation and conveniently invite customers or employees by email. An online questionnaire enables you to gather insights quickly and easily to improve customer or employee satisfaction. You can register for the LamaPoll survey tool free of charge and immediately create and run online surveys with up to 50 participants. If you need more responses for your online questionnaire, simply choose one of our plans: billed monthly, cancel any month. You can also choose from our online questionnaire templates and examples.