
Once the survey is complete, the important phase of evaluating, analysing and presenting the results begins. The responses submitted by survey participants need to be analysed carefully, while the results also need to be prepared and presented clearly. On this page, you will learn what to consider when analysing responses and which elements you can use to create an effective presentation of your survey results. Not every analysis step described here is necessary for every survey, so you can use or omit individual steps depending on your needs and available time.
Table of Contents
Monitor results while the survey is running
As part of quality assurance, carry out a drop-off analysis early enough to optimise the survey in time if necessary. In addition to drop-off analysis, LamaPoll provides other useful statistics, such as completion time.
Clean up survey results after completion
To obtain a meaningful overall result, it may be necessary to exclude the responses of individual respondents. For example, if respondents abandon the questionnaire after one of the first questions or click through it unusually quickly, these individual results can distort the overall result. Questionnaires showing clear response patterns or tendencies, such as repeatedly choosing the middle response option, should also be checked for inconsistencies.
To clean up the results accordingly, it is advisable to analyse individual response behaviour. An unusually short completion time can provide important clues: respondents who simply click through the questionnaire can be identified in this way and, if necessary, excluded from the overall results. Individual responses should also be checked for response patterns and inconsistencies and, where appropriate, removed from the overall results.
Including semantically reversed control questions in the questionnaire can help identify possible response tendencies. However, control questions with altered scales can also cause comprehension problems. Consider in advance whether the survey logic will be clear to everyone.
Analyse results
1. Compare results horizontally and across groups
Comparisons between a subgroup and the full set of respondents, or between specific groups at the same level, can provide important insights. Horizontal comparisons are comparisons between a subgroup and the overall group of respondents. For example, you can compare the results of one department with the overall result for a site, or with the overall result for all respondents. Significant differences should be examined more closely as part of a careful analysis. What might explain, for example, different satisfaction scores or a lower percentage of survey participation? Questions like these may need further investigation so that important factors are taken into account when interpreting the results.
Cross-comparisons between groups at the same level, such as Department A versus Department B or one site versus another, can also help identify relevant differences. If significant differences emerge, the analysis should investigate the possible causes. Comments left by respondents in the questionnaire can, for example, provide additional context.
2. Use result filters
When analysing a survey, you are often interested not only in the overall results for all respondents, but also in the results for individual groups. Results can be filtered directly in LamaPoll, for example so that only responses from people who answered or did not answer specific questions are displayed and included in the analysis. You can also filter for respondents who meet certain criteria, such as particular age groups or departments. Survey results can additionally be filtered by status, for example only respondents who completed the survey, by attributes, such as only men or only managers, or by response behaviour, such as only respondents who answered a particular question with yes.
Filtered subsets can be exported in the same way as the overall survey results. You can find more information about exporting results, including raw-data and overall-results exports, in the relevant section below. Further information on using result filters is available in our Helpdesk article on result filters.
With just a few clicks, you can filter out hidden or combined result sets, view them graphically and export them for use in a presentation if required.
3. Examine relationships using the comparison function and cross-tabulation
The comparison function lets you identify relevant differences between respondent groups or characteristics in a clear table and perform cross-tabulations. Differences between individual departments, sites, genders, hierarchy levels and other groups can also be examined. Cross-tabulation is generally used to identify possible relationships between variables. It can also be used to examine whether variables are independent of one another. It is therefore a method for analysing relationships, or independence, between variables. The analysis can consider not only whether relationships exist, but also their significance and strength.
Examples of relationships that could be investigated in surveys using cross-tabulation include dependencies between specific characteristics:
- Is there, for example, a relationship between age group and purchasing behaviour?
- Is there a relationship between level of education and voting behaviour?
- Follow-up questions might include: Are the relationships significant? How strong are they?
The comparison function provides a clearer way to analyse groups side by side than result filters. Filters can isolate and display the results of specific groups, but they do not compare those groups in a single table.
The comparison function is available from the Gold plan upwards. To try the feature without obligation, you can activate the free 14-day trial.
Export results: raw data and overall results
Once the survey has ended, the data can be downloaded easily. Both raw-data and overall-results exports are available. Raw data lets you see which responses were submitted by each individual respondent. In anonymous surveys, the raw data does not include respondents' names or email addresses, so the submitted responses cannot be assigned to individual respondents. If, on the other hand, you conducted a non-anonymous survey and sent invitations using the LamaPoll address book, the raw data also includes respondents' email addresses and names.
- choose from different file formats (Excel, Word, PowerPoint, or an HTML file for websites/browsers)
- define the time period
- apply an existing filter
- export with or without charts
- export with or without status data
- export with or without coding
Would you like to access individual results on the Free plan? No problem: the Free plan also gives you access to individual response results, where you can view the responses submitted by individual participants. In the analysis menu, you can select individual participants from a drop-down menu and display their responses.
Raw-data export is included in every paid plan, but not in the Free plan. To test this feature, activate the free 14-day trial.
Presenting survey results
Download charts for your presentation
LamaPoll is designed to display relevant results graphically and let you download them with a click. Ready-made charts are generated automatically for each question. Depending on the question type, you can select the most suitable chart for your presentation and download it as a PNG image. Analysing the results is therefore just as simple and convenient as creating the questionnaire. With only a few clicks, you can also filter hidden or combined results, view them graphically or in tables, and export them for a presentation.
- column chart
- bar chart
- pie chart
- 3D pie chart
- doughnut chart
- table view
Export and edit charts in Excel
If you export the overall results or the results for individual questions including a chart, Excel generally displays a pie chart. You can change the chart type there with a few clicks if required.
Export charts to PowerPoint
After export, PowerPoint displays column charts by default. If you want to use other chart types in your presentation, first export the results to Excel. You can change the chart type there with a click, as described above. In a second step, the relevant worksheet can then be inserted into PowerPoint. In PowerPoint, open the “Insert” tab, select “Object”, then “Create from File”, and use “Browse” to select the relevant worksheet. Finally, select “Link” and “OK”.
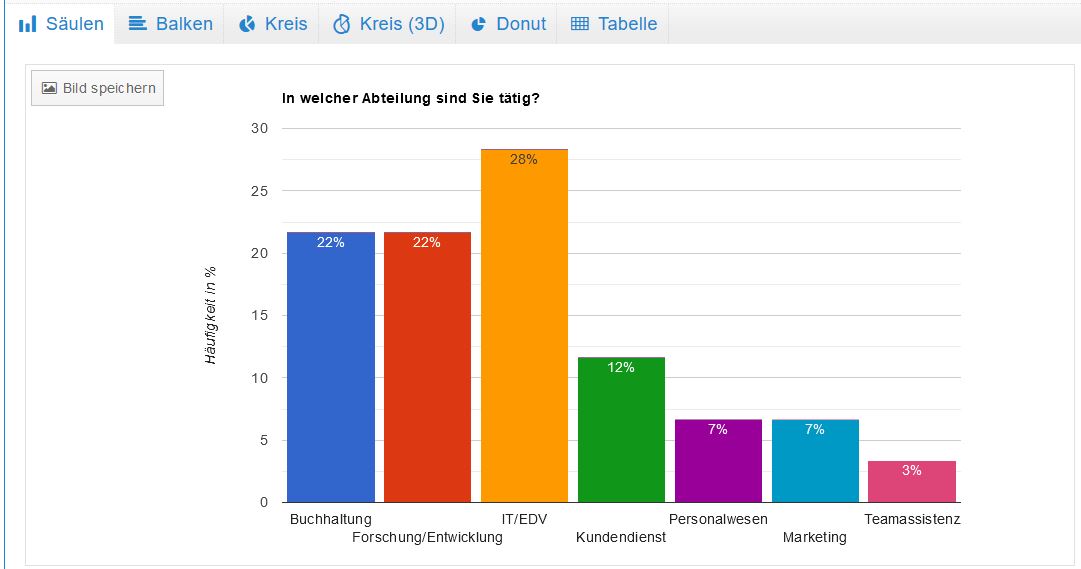
The different chart types can be displayed using the relevant tabs and downloaded with a click.
The different chart types can easily be downloaded as PNG image files with a click and added to your presentation.
Presenting survey results: tips and tricks
- be tailored to the target audience
- be clear and easy to understand
- contain clear visual elements such as charts and infographics
- be adapted to the corporate design
- include comparisons with previous surveys where appropriate
- include conclusions
- support the development of recommendations for action
The scope and content of the presentation should be tailored to the relevant target audience, such as management, employees, department heads, customers or participants.
What is LamaPoll?
LamaPoll is the premium survey tool for creating your own online surveys. Regardless of the context or objective, whether you are surveying employees or customers, you can create attractive, easy-to-use questionnaires in your own design and fully optimised for all devices. You retain full control over your data: your data is stored on dedicated, certified servers located exclusively within the Federal Republic of Germany and is subject, among other legislation, to the German Federal Data Protection Act.
Even with the Free plan, you can create your own survey and receive results for 50 participants, presented in attractive charts and ready to download. Our Flexi rates provide more features, convenience and participants. They can be cancelled monthly with a simple click, so you only pay for as long as you want.
Our templates and examples for online surveys are of course available free of charge.