The Net Promoter Score, also known as the promoter surplus, is an easy-to-calculate metric that can be used as an indicator of business success. But how is the NPS calculated, and how can the results be interpreted correctly? The following sections explain how to calculate the metric and interpret the result.
Table of Contents
Calculating the Net Promoter Score
Your Net Promoter Score is calculated using a single question that you ask a representative group of your customers: “On a scale from 0 to 10, how likely are you to recommend [company name/brand/product] to your friends, relatives or business partners?”
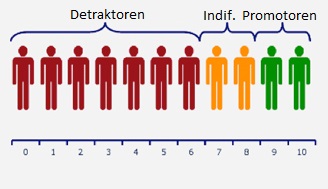
Customers who respond with a score of 6 or lower are detractors, those who give a 7 or 8 are classed as passives (indifferent customers), and those who give a 9 or 10 are promoters.
To calculate your Net Promoter Score, subtract the percentage of detractors from the percentage of promoters. It is as simple as that. If, for example, 50% of respondents are promoters and 10% are detractors, your NPS is 40.
The NPS calculation and the different customer groups at a glance:
Net Promoter Score calculation: NPS = promoters (%) − detractors (%)
The NPS therefore ranges from plus 100% to minus 100%.
How to interpret your NPS results correctly
Although the NPS measures the likelihood of an action based on past experience, it has nevertheless proved to be a reliable indicator of a company's future growth or decline. In other words, this figure helps you identify problems at both individual customer and overall customer level.
Your company's Net Promoter Scores may vary across different segments, such as age group, gender, long-standing customers or higher-spending customers.
If you are just starting to use NPS, you do not need this level of detail. All the information you collect at this stage will help you build a clear picture.
Once you are more experienced in using this metric, you can deepen your analysis by setting up segmentation systems and determining how to adapt your approach to different types of customer.
As the Net Promoter Score is a real-time metric, you can measure it as often as you wish—in theory, even daily.
However, actual performance only becomes apparent over time, when you can identify trends and fluctuations. Achieving a high response rate for every survey can be difficult. Treat surveys that reach a large number of respondents as benchmarks for improvements to your next survey.
Once you have recorded how your score changes over time, you can investigate which factors may have contributed to those changes.
NPS is more than just a number. The truly valuable information comes from the follow-up questions you ask as part of the survey. It is therefore essential to engage with customers to understand the context and reasons behind their rating.
Individual interviews or follow-up sessions, for example, allow you to explore specific issues. This ultimately helps you identify what can and should be improved. It also makes it easier to focus your efforts in a genuinely customer-centric direction.
NPS customer satisfaction survey